

Activity Breakdown
Properties for Sale
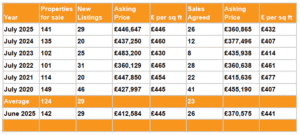
● July 2024 to July 2025: +4.4% (from 135 to 141)
● June 2025 to July 2025: -0.7% (from 142 to 141)
● July 2025 vs. six-year July average (124): +13.7%
New Listings
● July 2024 to July 2025: +45.0% (from 20 to 29)
● June 2025 to July 2025: 0.0% (both 29)
● July 2025 vs. six-year July average (29): 0.0%
Sales Agreed
● July 2024 to July 2025: +116.7% (from 12 to 26)
● June 2025 to July 2025: 0.0% (both 26)
● July 2025 vs. six-year July average (23): +13.0%
2. Price Changes, Withdrawns, and Fall-Throughs
Price Changes
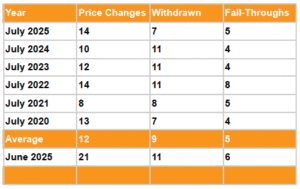
● July 2024 to July 2025: +40.0% (from 10 to 14)
● June 2025 to July 2025: -33.3% (from 21 to 14)
● July 2025 vs. six-year July average (12): +16.7%
Withdrawn
● July 2024 to July 2025: -36.4% (from 11 to 7)
● June 2025 to July 2025: -36.4% (from 11 to 7)
● July 2025 vs. six-year July average (9): -22.2%
Fall-Throughs
● July 2024 to July 2025: +25.0% (from 4 to 5)
● June 2025 to July 2025: -16.7% (from 6 to 5)
● July 2025 vs. six-year July average (5): 0.0%
3. Asking Prices and £ per Sq Ft
New Listings Asking Price
● July 2024 to July 2025: +2.1% (from £437,250 to £446,647)
● June 2025 to July 2025: +8.2% (from £412,584 to £446,647)
Sales Agreed Asking Price
● July 2024 to July 2025: -4.4% (from £377,496 to £360,865)
● June 2025 to July 2025: -2.6% (from £370,575 to £360,865)
New Listings £ per Sq Ft
● July 2024 to July 2025: -3.0% (from £460 to £446)
● June 2025 to July 2025: +0.2% (from £445 to £446)
Sales Agreed £ per Sq Ft
● July 2024 to July 2025: +6.1% (from £407 to £432)
● June 2025 to July 2025: -2.0% (from £441 to £432)
The SG7 market showed noticeable strength and momentum this July, particularly when compared with a subdued July 2024. Demand is improving, pricing is beginning to stabilise, and sellers are clearly more confident entering the market.
Activity Picks Up — Sales More Than Double
Sales agreed more than doubled year-on-year, rising 116.7% from 12 in July 2024 to 26 in July 2025. This signals a stronger pool of committed buyers and improved realism around asking prices.
New listings were also up sharply, climbing 45% year-on-year. This was the highest July figure since 2020, and precisely in line with the six-year July average.
Properties for sale also ticked up, from 135 last July to 141, putting stock levels 13.7% above the six-year average. This reflects greater vendor confidence and possibly some longer marketing cycles.
Pricing — Mixed Signals, But Signs of Balance
There’s been a slight increase in the average asking price for new listings, up 2.1% annually to £446,647. Encouragingly, this is coupled with a small decline in the average asking price for sales agreed, down 4.4% to £360,865. This narrowing gap between asking and achieved prices suggests more pricing alignment between buyers and sellers , a key ingredient for a fluid market.
£ per Sq Ft — Values Holding Up
For new listings, average £/sq ft was £446, slightly down from £460 last year. Meanwhile, sales agreed rose from £407 to £432, a 6.1% increase, indicating that quality homes in the right condition and location are commanding strong values.
Price Adjustments and Withdrawals
Price changes rose from 10 to 14, slightly above the long-term July average. Withdrawals fell notably, down from 11 to 7, suggesting more vendors are sticking with their sales. Fall-throughs remain low and stable at 5.
Summary
The SG7 market in July 2025 is characterised by:
● Strong bounce in buyer commitment and sales.
● Sensible pricing adjustments.
● Vendor confidence returning.
● £/sq ft values showing resilience.
It’s a market that is neither overheated nor stuck, just active, balanced, and encouraging for both buyers and sellers.